
Page 24 - (Final)Annual Membership Satisfaction Survey 2020 (1)
P. 24
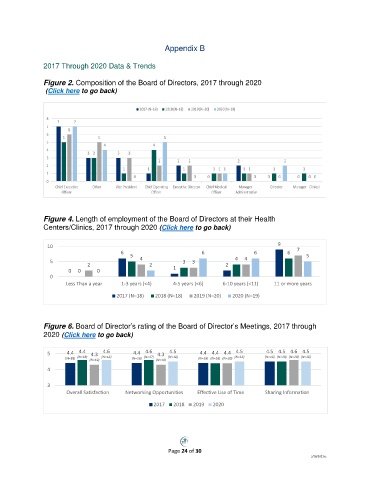
Appendix B

               2017 Through 2020 Data & Trends

               Figure 2. Composition of the Board of Directors, 2017 through 2020
                (Click here to go back)


               Figure 4. Length of employment of the Board of Directors at their Health
               Centers/Clinics, 2017 through 2020 (Click here to go back)

                 10                                                                          9
                                         6  5                       6                6          6  7  5
                  5           2                4  2          3   3          2  4  4
                        0  0     0                        1
                  0
                       Less Than a year  1-3 years (<4)   4-5 years (<6)   6-10 years (<11)  11 or more years
                                        2017 (N=18)  2018 (N=18)  2019 (N=20)  2020 (N=19)


               Figure 6. Board of Director’s rating of the Board of Director’s Meetings, 2017 through
               2020 (Click here to go back)

                 5     4.4  4.4  4.3  4.6    4.4  4.6  4.3  4.5    4.4 4.4 4.4  4.5      4.5 4.5 4.6 4.5
                       (N=18)  (N=18)  (N=19)  (N=18)  (N=18)  (N=17)  (N=19)  (N=18)  (N=18) (N=18) (N=20)  (N=18)  (N=18) (N=18) (N=20) (N=18)
                 4


                 3
                       Overall Satisfaction  Networking Opportunities  Effective Use of Time  Sharing Information

                                                    2017  2018   2019  2020


                                                         Page 24 of 30
                                                                                                        5/18/2021sc