
Page 25 - (Final)Annual Membership Satisfaction Survey 2020 (1)
P. 25
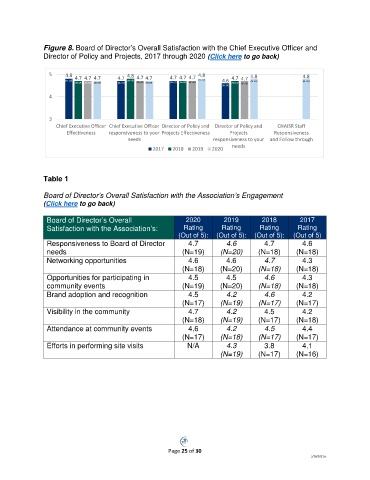
Figure 8. Board of Director’s Overall Satisfaction with the Chief Executive Officer and
               Director of Policy and Projects, 2017 through 2020 (Click here to go back)

                 5     4.8                 4.8                     4.8              4.8              4.8
                       (N=18)  4.7 4.7 4.7  4.7  (N=18)  4.7 4.7  4.7 4.7 4.7  (N=19)  4.6  4.7 4.7  (N=18)  (N=19)
                          (N=18)  (N=20)  (N=19)  (N=18)  (N=20) (N=19)  (N=17)  (N=18)  (N=20)  (N=18)  (N=20)
                                                                           (N=16)
                 4


                 3
                    Chief Executive Officer Chief Executive Officer Director of Policy and Director of Policy and  CHAISR Staff
                       Effectiveness  responsiveness to your Projects Effectiveness  Projects  Responsiveness
                                           needs                        responsiveness to your  and Follow through
                                                    2017  2018   2019  2020   needs


               Table 1

               Board of Director’s Overall Satisfaction with the Association’s Engagement
               (Click here to go back)

                 Board of Director’s Overall                   2020        2019         2018        2017
                 Satisfaction with the Association’s:         Rating      Rating       Rating       Rating
                                                            (Out of 5):  (Out of 5):  (Out of 5):   (Out of 5)
                 Responsiveness to Board of Director           4.7          4.6         4.7          4.6
                 needs                                       (N=19)       (N=20)      (N=18)       (N=18)
                 Networking opportunities                      4.6          4.6         4.7          4.3
                                                             (N=18)       (N=20)      (N=18)       (N=18)
                 Opportunities for participating in            4.5          4.5         4.6          4.3
                 community events                            (N=19)       (N=20)      (N=18)       (N=18)
                 Brand adoption and recognition                4.5          4.2         4.6          4.2
                                                             (N=17)       (N=19)      (N=17)       (N=17)
                 Visibility in the community                   4.7          4.2         4.5          4.2
                                                             (N=18)       (N=19)      (N=17)       (N=18)
                 Attendance at community events                4.6          4.2         4.5          4.4
                                                             (N=17)       (N=18)      (N=17)       (N=17)
                 Efforts in performing site visits             N/A          4.3         3.8          4.1
                                                                          (N=19)      (N=17)       (N=16)


                                                         Page 25 of 30
                                                                                                        5/18/2021sc