
Page 8 - (Final)Annual Membership Satisfaction Survey 2020 (1)
P. 8
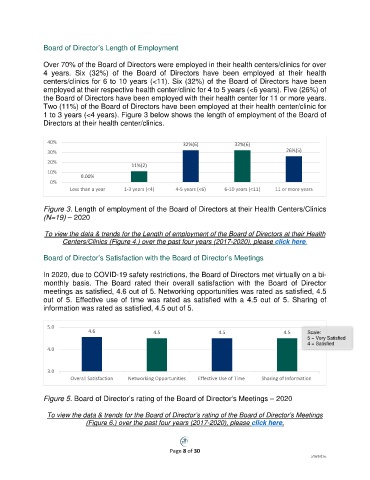
Board of Director’s Length of Employment

               Over 70% of the Board of Directors were employed in their health centers/clinics for over
               4 years.  Six  (32%) of the Board  of  Directors  have been employed at their health
               centers/clinics for 6 to 10 years (<11). Six (32%) of the Board of Directors have been
               employed at their respective health center/clinic for 4 to 5 years (<6 years). Five (26%) of
               the Board of Directors have been employed with their health center for 11 or more years.
               Two (11%) of the Board of Directors have been employed at their health center/clinic for
               1 to 3 years (<4 years). Figure 3 below shows the length of employment of the Board of
               Directors at their health center/clinics.

                 40%                                          32%(6)           32%(6)

                 30%                                                                            26%(5)
                 20%
                                             11%(2)
                 10%
                            0.00%
                  0%
                        Less than a year  1-3 years (<4)   4-5 years (<6)  6-10 years (<11)  11 or more years


               Figure 3. Length of employment of the Board of Directors at their Health Centers/Clinics
               (N=19) – 2020

                To view the data & trends for the Length of employment of the Board of Directors at their Health
                      Centers/Clinics (Figure 4.) over the past four years (2017-2020), please click here.

               Board of Director’s Satisfaction with the Board of Director’s Meetings

               In 2020, due to COVID-19 safety restrictions, the Board of Directors met virtually on a bi-
               monthly basis. The  Board  rated their overall  satisfaction  with  the  Board of Director
               meetings as satisfied, 4.6 out of 5. Networking opportunities was rated as satisfied, 4.5
               out of 5. Effective use  of time  was  rated  as  satisfied with  a  4.5  out  of 5.  Sharing of
               information was rated as satisfied, 4.5 out of 5.


                 5 5.0       4.6
                              4.6
                                                                         4.5
                             (n=19)                4.4 4.5               4.3                   4.5     Scale:
                                                   (N=20)                                      4.3     5 = Very Satisfied
                                                                         (N=20)                (n=19)
                                                                                                       4 = Satisfied
                 4 4.0
                 3 3.0
                                                                                        Sharing of Information
                        Overall Satisfaction
                      Sharing of Information  Networking Opportunities  Effective Use of Time  Networking Opportunities
                                                                   Overall Satisfaction
                                            Effective Use of Time


               Figure 5. Board of Director’s rating of the Board of Director’s Meetings – 2020

                 To view the data & trends for the Board of Director’s rating of the Board of Director’s Meetings
                             (Figure 6.) over the past four years (2017-2020), please click here.


                                                         Page 8 of 30
                                                                                                        5/18/2021sc